RTX performance on Windows
Message boards :
Number crunching :
RTX performance on Windows
Message board moderation
| Author | Message |
|---|---|
|
Send message Joined: 7 Jan 17 Posts: 34 Credit: 1,371,429,518 RAC: 0 Level Scientific publications |
First of all, it's awesome that there's plenty of work again. I am happily crunching again on my favourite GPU project. Now, I've noticed two things with the new WUs: a) Interrupted WUs cannot be continued, I get an instant error. I guess this is nothing new, though. b) My RTX 2080 can't seem to get maxed out, I'm lucky to make it above 80% (whereas a 1660 Ti and a 1060 3GB in the same system don't have that problem, although the other Turing also usually stays below 90%). I compared some tasks and it seems that it is outperformed by 25% by a 2070 in another host of mine running Linux. I have another 1060 3GB on Linux and it performs very closely to the one on Windows. For the record, SWAN_SYNC is enabled and a full thread reserved for each task. Any way to fix? Any ideas, comments? Anyone else observe this on their rigs? EDIT: Maybe move this to the GPU subforum, I dunno. |
|
Send message Joined: 13 Dec 17 Posts: 1424 Credit: 9,189,946,190 RAC: 13 Level Scientific publications |
I run all Linux hosts and the most powerful card I have is a RTX2080. But all my currently running tasks show over 99% cpu usage and at least 92% gpu usage as shown in nvidia-smi. I have an app_config setting cpu usage to 1 core to support the gpu tasks. Swan sync is no longer used or even enabled for both Windows and Linux hosts running the acemd3 app. Not a factor. The speed of the task in Linux is just, because in general, Linux is faster than Windows because of less overhead in the OS. |
|
Send message Joined: 7 Jan 17 Posts: 34 Credit: 1,371,429,518 RAC: 0 Level Scientific publications |
I know Linux is generally faster, however I don't remember the difference being that stark and core load was always at least around 90% (admittedly my experience is naturally limited to the old app). Also, as I said, the Pascal card seems more or less the same on Windows. Right now the RTX is literally running at 70% core load. I tried doing two tasks in tandem, but that didn't contribute anything. Can't we do better? :) |
 Retvari Zoltan Retvari ZoltanSend message Joined: 20 Jan 09 Posts: 2380 Credit: 16,897,957,044 RAC: 0 Level Scientific publications |
a) Interrupted WUs cannot be continued, I get an instant error. I guess this is nothing new, though.It happens if you have different GPUs in the same system, and the task restarts on a different GPU than it was running before. To avoid this you should suspend the queued GPUGrid tasks first, then the running GPUGrid tasks one by one, and make note which GPU became unused before you suspend the next running task. After restart first you should resume the task which was running on device 0, then the task was running on device 1 and so on, then the unprocessed tasks. b) My RTX 2080 can't seem to get maxed out, I'm lucky to make it above 80% (whereas a 1660 Ti and a 1060 3GB in the same system don't have that problem, although the other Turing also usually stays below 90%).It's usually the result of an overcomitted CPU. Depending on the other (CPU+GPU) tasks running it is advised to reduce the number of simultaneous CPU tasks to the number of CPU cores (50% of CPUs in BOINC manager / Computing settings), or even less. High core count CPUs (AMD Threadripper, Intel i9-9900, AMD Ryzen 9 3950x) can use up their memory bandwidth when many CPU tasks are running simultaneously, even with 4 channel memory. This result in increased runtime of the CPU app, and reduced performance of the GPU app. Reduced PCIe bandwidth can also be the cause of reduced GPUGrid performance. CPUs with 20 PCIe lanes can't provide PCIe 3.0 x16 for all GPUs in a multi-GPU setup. The other factor is the atom count of the given simulation - we don't have any info on that with the new GPUGrid app - but I think the present batch has low atom count, and it can cause lower GPU utilization on high-end GPUs. The third factor is the host OS: Linux tends to be faster (however the previous batch was just as fast on Windows). I see 89% GPU (RTX 2080Ti) usage under Windows 10, while 97-98% GPU (RTX 2080Ti) usage under Linux. For the record, SWAN_SYNC is enabled and a full thread reserved for each task.SWAN_SYNC is always on for the acemd3, this environmental variable is ignored. |
|
Send message Joined: 7 Jan 17 Posts: 34 Credit: 1,371,429,518 RAC: 0 Level Scientific publications |
It happens if you have different GPUs in the same system, and the task restarts on a different GPU than it was running before. ah right, gotcha. I remember it resuming on a different GPU being the problem now. It's usually the result of an overcomitted CPU. Depending on the other (CPU+GPU) tasks running it is advised to reduce the number of simultaneous CPU tasks to the number of CPU cores (50% of CPUs in BOINC manager / Computing settings), or even less. High core count CPUs (AMD Threadripper, Intel i9-9900, AMD Ryzen 9 3950x) can use up their memory bandwidth when many CPU tasks are running simultaneously, even with 4 channel memory. This result in increased runtime of the CPU app, and reduced performance of the GPU app. I set cores used to 50% and the RTX load went up by maybe 1-2%. Setting it even lower adds maybe another percent, adding up to a whoopin' 82% for this particular WU. Running Rosetta on CPU right now, which I guess it quite memory intensive, but I was doing more forgiving stuff previously too and GPU usage was the same. Reduced PCIe bandwidth can also be the cause of reduced GPUGrid performance. CPUs with 20 PCIe lanes can't provide PCIe 3.0 x16 for all GPUs in a multi-GPU setup. I have PCI-E 2.0, three cards. Bus load is below 10% for the RTX anyway. The 1950X has 64 lanes, apparently? The other factor is the atom count of the given simulation - we don't have any info on that with the new GPUGrid app - but I think the present batch has low atom count, and it can cause lower GPU utilization on high-end GPUs. I think best I got so far was maybe 85%. |
|
Send message Joined: 7 Jan 17 Posts: 34 Credit: 1,371,429,518 RAC: 0 Level Scientific publications |
Hm okay then, now I got a WU that's running around 90% on the RTX. |
|
Send message Joined: 3 Sep 13 Posts: 53 Credit: 1,533,531,731 RAC: 0 Level Scientific publications |
I two have nearly identical systems: same CPU, almost identical motherboard, same GPU. The main hardware difference is RAM. One is Windows 8 and the other Linux, and the Linux box has the lesser quality RAM. GPU load under Linux is ~90% or higher, under Windows it's ~50-60% depending. I can get it marginally higher if I completely stop CPU work, but that's not a reasonable trade-off in my opinion. The Windows app just seems to be much less efficient, whatever the reason. This has been the case since the ACEMD3 release. Team USA forum | Team USA page Join us and #crunchforcures. We are now also folding:join team ID 236370! |
|
Retvari Zoltan Send message Joined: 20 Jan 09 Posts: 2380 Credit: 16,897,957,044 RAC: 0 Level Scientific publications |
GPU load under Linux is ~90% or higher, under Windows it's ~50-60% depending.This is way too low. How did you get this readout? In Windows task manager the main display for GPU usage don't show the right value. You should change one of the sub-displays to "CUDA" to get the right one. |
|
Send message Joined: 3 Sep 13 Posts: 53 Credit: 1,533,531,731 RAC: 0 Level Scientific publications |
GPU load under Linux is ~90% or higher, under Windows it's ~50-60% depending.This is way too low. How did you get this readout? System Information Viewer and Nvidia Inspector. I've verified these values with Nvidia-SMI too. There is quite a bit of variance in these jobs, since my previous post I've seen a job or two using ~80% of the card. But that's not usual. I've tried running two at a time but it didn't really improve run times. Team USA forum | Team USA page Join us and #crunchforcures. We are now also folding:join team ID 236370! |
|
Send message Joined: 7 Jan 17 Posts: 34 Credit: 1,371,429,518 RAC: 0 Level Scientific publications |
I have PCI-E 2.0 Err, nevermind me, it's 3.0, durr |
|
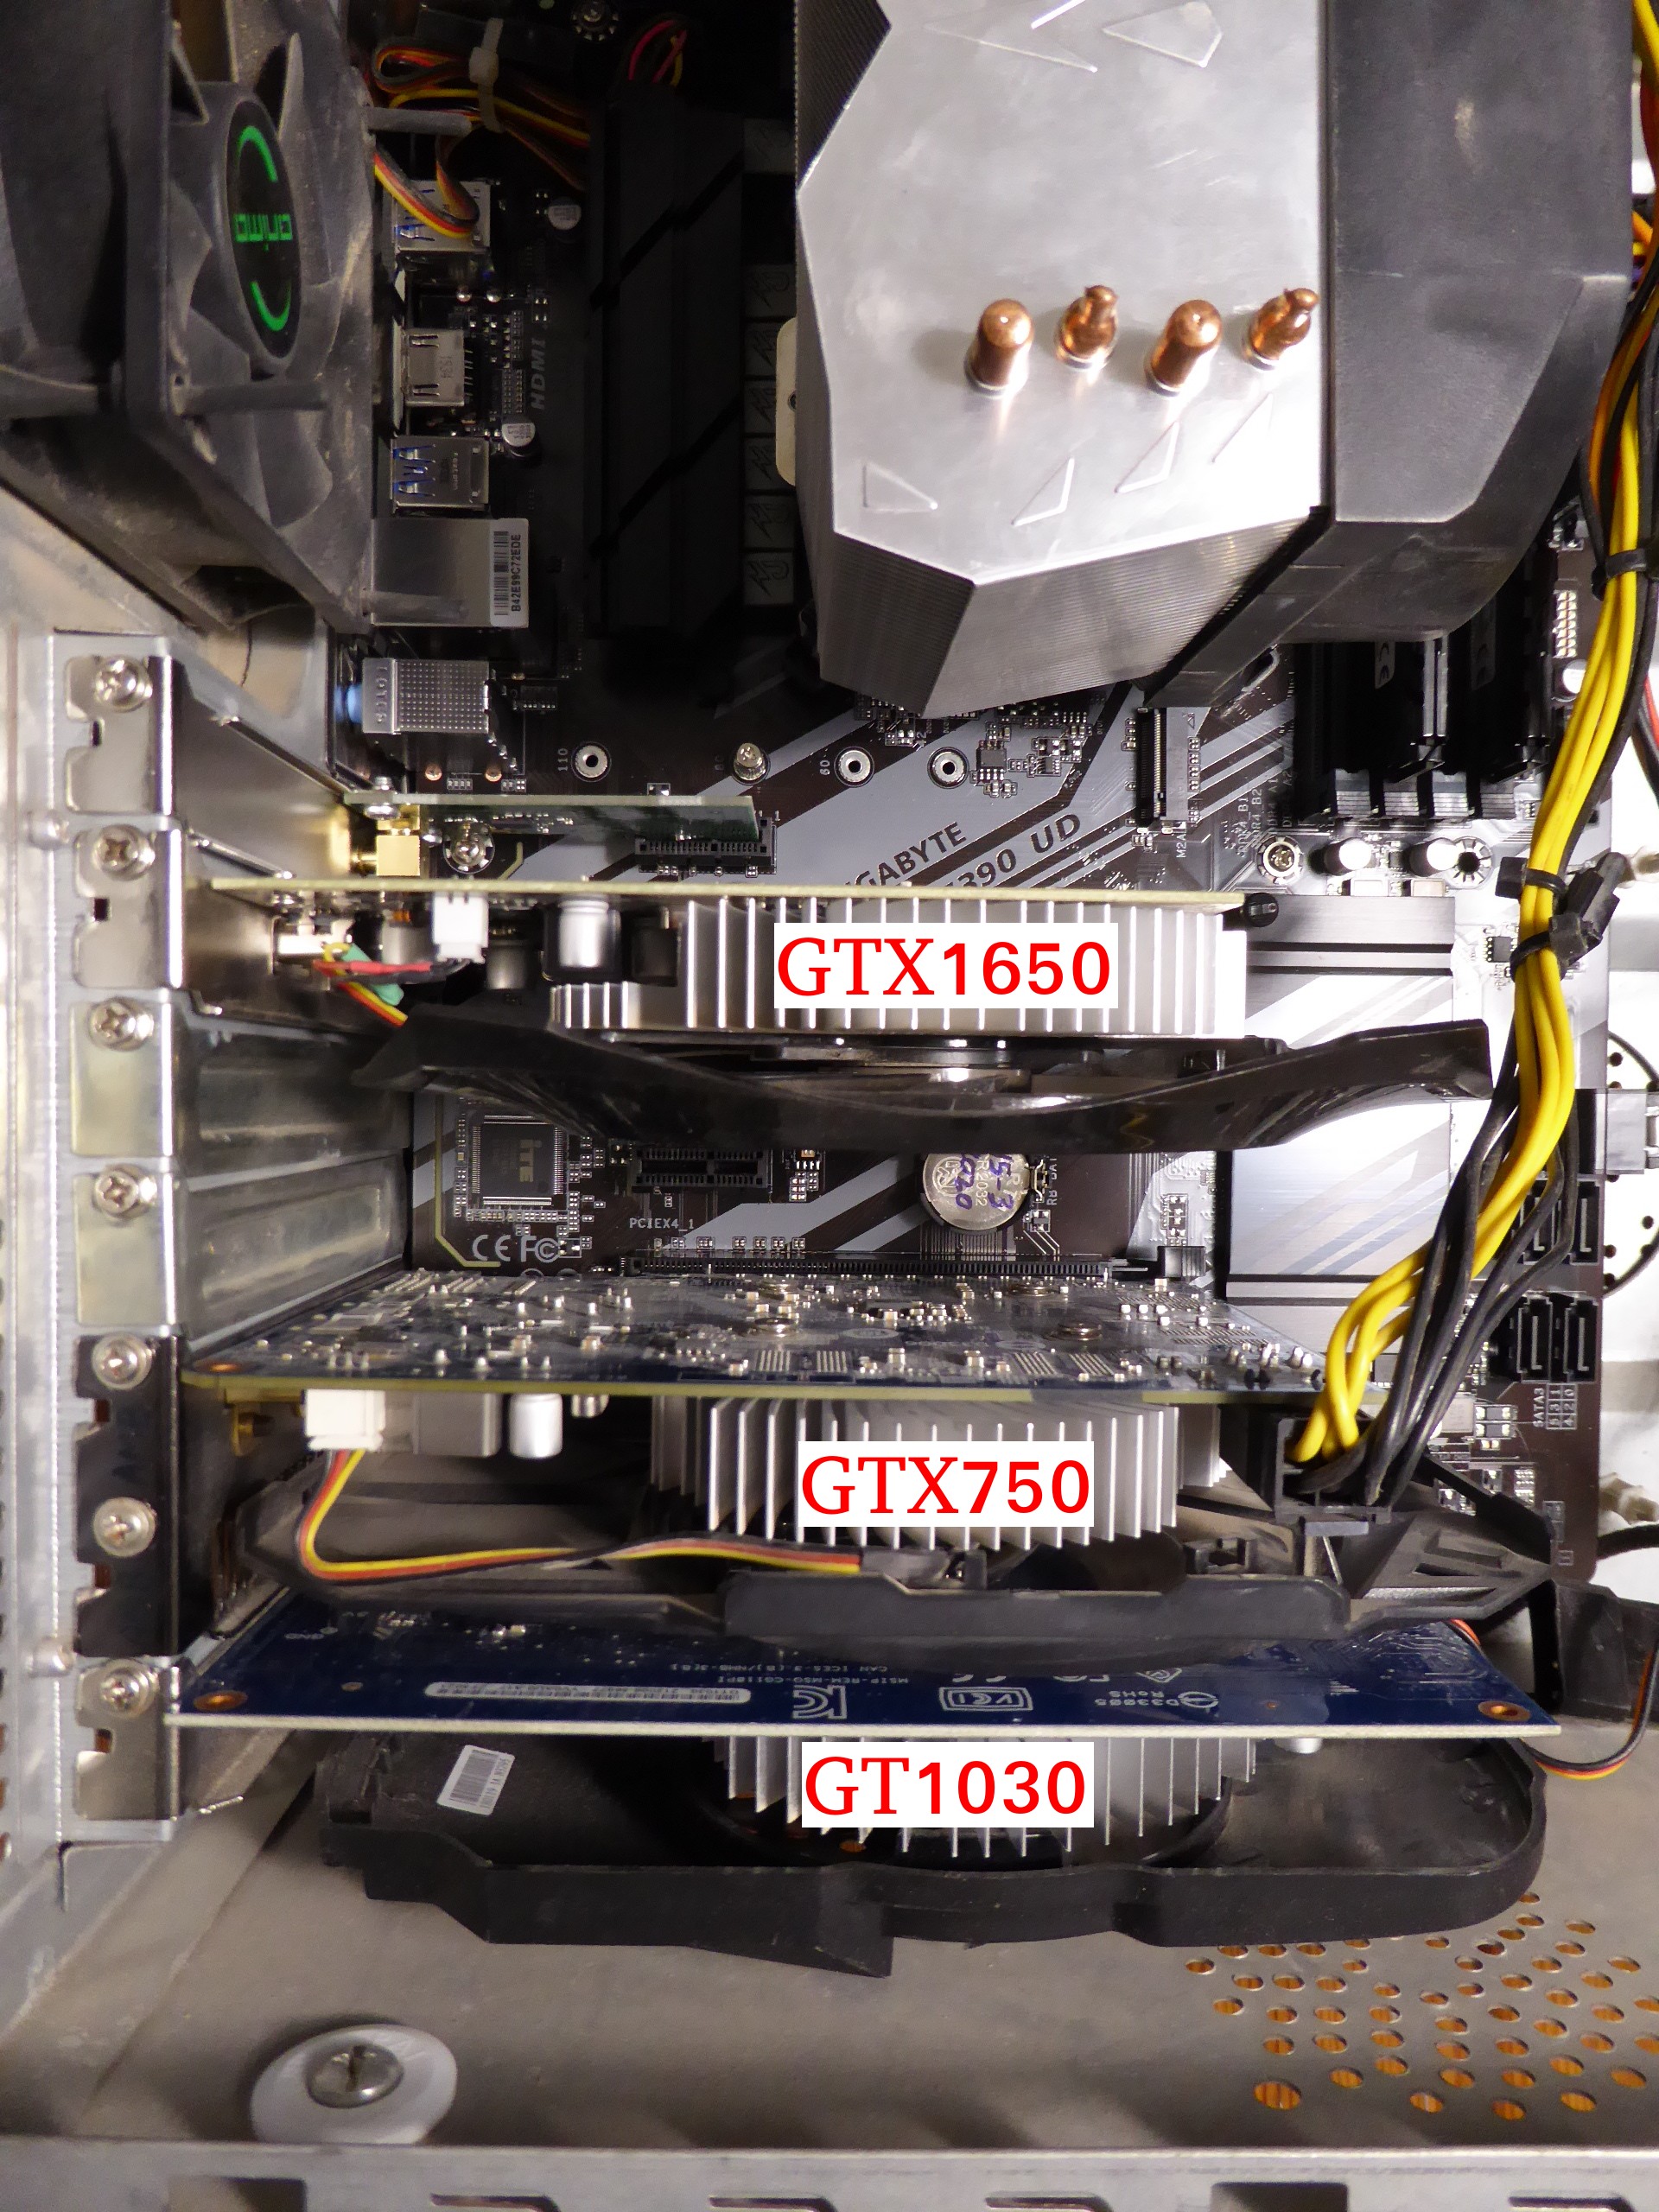
ServicEnginIC Send message Joined: 24 Sep 10 Posts: 595 Credit: 13,083,686,510 RAC: 4,433,775 Level Scientific publications |
a) Interrupted WUs cannot be continued, I get an instant error. I guess this is nothing new, though. Thank you very much, Retvari Zoltan. Your ingenious method works fine for me on this triple mixed graphics card system. I'm taking it in mind every time I reboot the system for any reason. It is a known problem in wrapper-working ACEMD3 tasks, already announced by Toni in a previous post. Can I use it on multi-GPU systems? |

©2026 Universitat Pompeu Fabra