NVidia GPU Card comparisons in GFLOPS peak
Message boards :
Graphics cards (GPUs) :
NVidia GPU Card comparisons in GFLOPS peak
Message board moderation
Previous · 1 . . . 8 · 9 · 10 · 11 · 12 · 13 · 14 . . . 17 · Next
| Author | Message |
|---|---|
|
Send message Joined: 18 Jun 12 Posts: 297 Credit: 3,572,627,986 RAC: 0 Level Scientific publications |
The 8350 has a TDP of 125w while the 680 is 195w x2 |
|
Send message Joined: 17 Aug 08 Posts: 2705 Credit: 1,311,122,549 RAC: 0 Level Scientific publications |
In games Titan typically uses ~200 W, which matches pretty well what we estimated here. GTX680 has a TDP of 195 W, but a power target of 170 W. That's why in games it consumes typically 170 W - the turbo mode boosts just high enough to hit that number, but not any higher. So if your card is cooled well and doesn't hit the maximum turbo bin, you know it's hitting 170 W. If it's not boosting at all it's above 170 W. @Flashhawk: I hope you've got at least an 80+ Gold PSU in that box? Otherwise such an investment should pay for itself quickly. MrS Scanning for our furry friends since Jan 2002 |
|
Send message Joined: 18 Jun 12 Posts: 297 Credit: 3,572,627,986 RAC: 0 Level Scientific publications |
They all have Seasonic 1050 watt Gold PSU's (just upgraded the last two), I haven't had any problems with them yet. The only problem I've had is the 36 hour TDR bug on one machine, I was pretty baffled over that one until I heard about it in another forum. |
 Send message Joined: 27 Oct 09 Posts: 18 Credit: 378,626,631 RAC: 0 Level Scientific publications |
It would be appreciated if you guys could update the OP with all the newer cards. |
 skgiven skgiven Send message Joined: 23 Apr 09 Posts: 3968 Credit: 1,995,359,260 RAC: 0 Level Scientific publications |
|
|
Zarck Send message Joined: 16 Aug 08 Posts: 145 Credit: 328,473,995 RAC: 0 Level Scientific publications |
Boinc on other websites there is a performance ranking of GPUs, on GPUGRID why not? http://setiathome.berkeley.edu/gpu_list.php http://registro.ibercivis.es/gpu_list.php http://albert.phys.uwm.edu/gpu_list.php http://boinc.freerainbowtables.com/distrrtgen/gpu_list.php http://boinc.thesonntags.com/collatz/gpu_list.php Etc. Sur d'autres sites Boinc il y a un classement des performances des GPUs, pourquoi pas sur GPUGRID ? @+ *_* |
|
skgiven Send message Joined: 23 Apr 09 Posts: 3968 Credit: 1,995,359,260 RAC: 0 Level Scientific publications |
This has been discussed at GPUGrid and privately during the last site revamp. The GPUGrid site is based on and adapted from a Boinc template, so it has the same template page, http://www.gpugrid.net/gpu_list.php The problem is the way the performance is calculated, the results are junk. If you used the results they would mislead you into believing some older cards were much better than they are. GPUGrid doesn't link to the page to prevent people being misled. Anyone buying a GPU should chose from the GK110 cards (GTX Titan, GTX780), or the GK104 GTX700 and GTX600 ranges, FAQ - Recommended GPUs for GPUGrid crunching - It's up to date. If you have an older card and it's on the list you can still use it, but we would not recommend buying an older card to specifically use for here. FAQ's HOW TO: - Opt out of Beta Tests - Ask for Help |
|
Send message Joined: 17 Aug 08 Posts: 2705 Credit: 1,311,122,549 RAC: 0 Level Scientific publications |
In addition to what SK said: look at SETI, there is 6. (0.348) ATI Radeon HD 5500/5600 series (Redwood) 7. (0.345) ATI Radeon HD 5700 series (Juniper) 8. (0.275) ATI Radeon HD 5800 series (Cypress) Which totally doesn't make sense at all. An HD5870 has about 7.7 times the raw horse power of a HD5550. And most of this difference should translate over to Seti real world performance. So the Seti list is off by a factor of 9.8, an entire order of magnitude. Pure junk. It would be much more useful to just list the maximum single precision flops, as imperfect as they are. MrS Scanning for our furry friends since Jan 2002 |
Michael Goetz Send message Joined: 2 Mar 09 Posts: 124 Credit: 124,873,744 RAC: 0 Level Scientific publications |
Like anything else, the statistics are only as good as the data put into it. After seeing this discussion, I went and implemented this page over at PrimeGrid. PrimeGrid diverged from the standard BOINC server many years ago, so updating it with new standard features is more work than it should be. I can't just load the latest and greatest from git. I used Milkyway's version of this page as the basis for PrimeGrid's (it's the first version I found on Google.) Therefore, I'm not sure if what I found is common to all BOINC projects or just them, but I found two major errors in the way the statistics were produced. The first was that the first result for each GPU was added to the list differently from all the rest. Its time was divided by the fpops estimate while all the subsequent result times weren't. They all should be divided. The second error -- far more serious -- was that ALL results were included. That includes faulty results, which may return with only a few seconds of elapsed time. That's going to skew the data significantly if a GPU with a bad driver or something similar is returning hundreds of bad results. Changing the DB query to only read validated results solves that problem. The end result looks very accurate. http://www.primegrid.com/gpu_list.php You'll notice that on our PPS Sieve application, the Nvidia GPUs are a lot faster than the AMD GPUs. This is an integer calculation, and team green is giving team red a sound thrashing on that application. The two GFN projects, however, are all double precision floating point, and AMD really shines there. The $300 7970 GPUs run at about the same speed as the $600 GTX TITAN. The numbers shown in those tables seem to be an accurate representation of actual speed. This assumes that you have accurate fpops estimates for all workunits. We've got fairly good fpops estimates at PrimeGrid, so the results of this GPU analysis are likely pretty good. If, however, the workunits are such that it's difficult or impossible to predict the fpops you're not going to get a good analysis of the GPU speeds. This isn't intended to be an argument; I'm merely pointing out that it may be possible for you to produce an accurate version of the table. I wholeheartedly agree that an inaccurate table is worse than useless. Mike |
|
Send message Joined: 1 Mar 10 Posts: 147 Credit: 1,077,535,540 RAC: 0 Level Scientific publications |
Hi Michael and everybody ! Just one silly question : why are bi-gpu (i.e 690 and 590) treated as single gpu . This is just taking in account the performance of a single chip on the card ? According to me, may be the performance should be calculated on a "GPU card" basis as a whole ? Cheers Lubuntu 16.04.1 LTS x64 |
|
Michael Goetz Send message Joined: 2 Mar 09 Posts: 124 Credit: 124,873,744 RAC: 0 Level Scientific publications |
Hi Michael and everybody ! If you're playing a game, multiple GPUs (whether on one card or many cards) can be combined together with SLI or Crossfire to increase game performance. However, for crunching, neither CUDA nor OpenCL provide the ability to combine the computational abilities. Although in theory it's possible for the application to be specially written to use multiple GPUs simultaneously, it's a lot more complicated -- and sometimes it's close to impossible. So, from BOINC's perspective, a 690 is no different than a pair of 680. There's no easy way to use it as a single GPU for crunching. The statistics page is dynamically generated directly from the results database; it doesn't have any knowledge of dual GPUs, overclocking, etc. As far as the server is concerned, a host with a 690 GPU has a pair of single-chip 690s rather than a single dual-chip 690. |
|
Send message Joined: 1 Mar 10 Posts: 147 Credit: 1,077,535,540 RAC: 0 Level Scientific publications |
I agree, this is what we can see in hosts descriptions... BOINC knows about the card type and they are not so many bi-gpu cards so the performance could be calculated on a card basis. Of course there is an exception for those using only 1 chip among 2 : odd number of gpu between the brackets in the description. Lubuntu 16.04.1 LTS x64 |
|
skgiven Send message Joined: 23 Apr 09 Posts: 3968 Credit: 1,995,359,260 RAC: 0 Level Scientific publications |
However, for crunching, neither CUDA nor OpenCL provide the ability to combine the computational abilities. My understanding is that outside the Boinc environment the ACEMD app can facilitate the use of multiple GPU's for the one WU - but correct me if I'm wrong. FAQ's HOW TO: - Opt out of Beta Tests - Ask for Help |
|
Send message Joined: 17 Aug 08 Posts: 2705 Credit: 1,311,122,549 RAC: 0 Level Scientific publications |
My understanding is that outside the Boinc environment the ACEMD app can facilitate the use of multiple GPU's for the one WU - but correct me if I'm wrong. Yes, I remember this as well. But anyhow, I think it makes sense to treat dual GPU cards in the same way as others and leave it to the user to figure out they've got double that throughput if you actually use both chips. It's the same as "BOINC can't tell you how fast your CPU will, unless it knows how many cores you are going to use." @Michael: thanks for joining the discussion! You data certainly looks far more sane than what we usually see on such pages. Did your bug fixes already find their way back into the BOINC root branch? It certainly sounds like a vast improvement for everyone :) However, there are still quite a few values in that table which don't make sense: GTX680 faster than Titan and GTX780, GTX660Ti faster than GTX670, GTX760 faster than.. you get the point. From quickly looking at these values there sseems to be about at least 10% noise in the data. As you said "the statistics are only as good as the data put into it". So for comparisons with one chip generation I'd rather revert to maximum SP-Flops and DP-Flops. And when in doubt, maybe because cards differ significantly in memory bandwidth, look for actual user provided data (because here the actual clock speeds etc. are known). But for comparing different card generations and vendors or to get the broad picture this table is certainly useful! In these cases the maximum Flops are not worth much. MrS Scanning for our furry friends since Jan 2002 |
|
Michael Goetz Send message Joined: 2 Mar 09 Posts: 124 Credit: 124,873,744 RAC: 0 Level Scientific publications |
@Michael: thanks for joining the discussion! You data certainly looks far more sane than what we usually see on such pages. Did your bug fixes already find their way back into the BOINC root branch? It certainly sounds like a vast improvement for everyone :) Short answer, no. I didn't take it from the BOINC repository, so I'm not at all sure how close what I have is to the latest and greatest. I'd be happy to share if anyone wants to look at it. (I wasn't even aware of this page until I read about it in this thread.) However, there are still quite a few values in that table which don't make sense: GTX680 faster than Titan and GTX780, GTX660Ti faster than GTX670, GTX760 faster than.. you get the point. From quickly looking at these values there sseems to be about at least 10% noise in the data. As you said "the statistics are only as good as the data put into it". So for comparisons with one chip generation I'd rather revert to maximum SP-Flops and DP-Flops. And when in doubt, maybe because cards differ significantly in memory bandwidth, look for actual user provided data (because here the actual clock speeds etc. are known). Indeed, I've noticed that too. Some of the unusual results are correct, some are noise. I added a disclaimer up at top that the results should be taken with a grain of salt. Kepler cards (6xx), for example, are horrible on our Genefer app and correctly rank below the 5xx (and maybe 4xx) cards. That's accurate. Some rankings aren't correct. The results are normalized against the fpops estimate and those were adjusted earlier this year. Some tasks take months to validate, so there may be some WUs still in there with bad fpops, and that would artificially inflate the speed of some GPUs. It's not perfect, but it's pretty good. (The three apps where PrimeGrid uses GPUs are either all inteeger matn, or all double precision apps, whereas games use single precision math. The GPUs are designed for gaming, so the speed of the apps in our apps doesn't always correlate to the published and expected speeds. (I lowered the threshold for minimum data points per GPU so that more GPUs would be included in the list, but that may allow more noise into the data. Perhaps adding a noise filter such as skipping any test that's more than x% away from the average would help too.) What I find most useful about that page is that it helps answer a fairly common question I get: "How come my brand new laptop is estimating 60 days for XXX?". Most people don't realize how huge a difference there is in GPU speeds, and expect the GT x20 GPU (or worse, GT x20M GPU) to be fast because it's new. On the chart, they can see that it's 20 times slower than the "big boys". They can look at the chart and quickly get a good sense of which ones are fast and which are slow -- and that a "slow" GPU is a VERY slow. |
|
Michael Goetz Send message Joined: 2 Mar 09 Posts: 124 Credit: 124,873,744 RAC: 0 Level Scientific publications |
Another source of error in the data is that BOINC only reports the first GPU if a system contains more than one GPU from the same vendor. Tasks that run on 'hidden' GPUs will count as running on the GPU that is visible. Even more confusing, if the task is suspended and restarted, BOINC will often start it on a different GPU, so the run time will be some combination of the speeds on each CPU. Also, the run time is gathered from the result table and the GPU type from the host table. If the GPU has been upgraded since the result was returned, the speed will be erroneously attributed to the new GPU. It's not a perfect analysis. |
|
Carlesa25 Send message Joined: 13 Nov 10 Posts: 328 Credit: 72,619,453 RAC: 0 Level Scientific publications |
Hello: The end result of a task performance when running BOINC is also heavily influenced by the associated CPUs GPUs. Not the same compare a GTX770 mounted with a FX8350 and GTX780 associated with a Phenom II. |
|
Send message Joined: 13 Apr 13 Posts: 61 Credit: 726,605,417 RAC: 0 Level Scientific publications |
With all the discussions on card performance, I started collecting data from the tasks page and putting it together for my own personal interest. What are the differences generation to generation, card to card, clock speeds, cuda, etc. The new debugging helped a lot to know which card data came from. So before posting the analysis, here are the conditions: * Windows Only, Long Tasks Only, No Beta Tasks, No SDOERR Tasks. * Any task that paused and restarted on the same card type was kept (e.g. GTX680, Pause, Restart GTX680). Even if it was a different physical card. If the task restarted on a different card (e.g. GTX680, Pause, GTX460), it was eliminated. * Memory size was grouped/changed when they were the "same". So all 1023Mb entries were changed to 1024 to keep the number of combinations down. * Tried to get at least 30 runs for each card for a fairly valid comparison. * All Analysis Y axis is GPU Run Time (sec). So here is overall filtered data set.  As noted before, the 768Mb cards take a hit. It was not just NOELIA runs, the SANTI and NATHAN also had runs which significantly slowed. From this point forward, all 768Mb cards are filtered out. Here is same chart less the 768Mb cads. 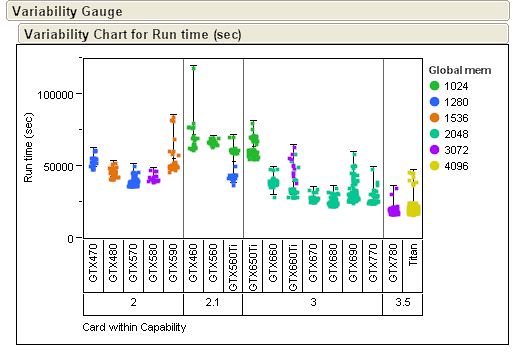 While reviewing the data within Compute Capability classes, Device Clock had the biggest impact. The 2.1 cards mix of 4xx and 5xx had odd results. The 3.5 had very little variation as I only pulled from one or two users. Here are the results for just the 2.0 and 3.0 cards. 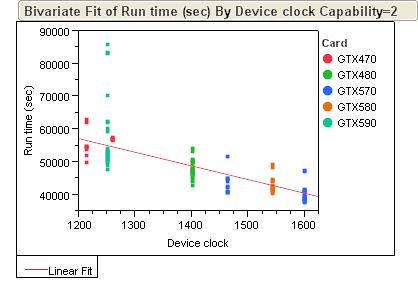 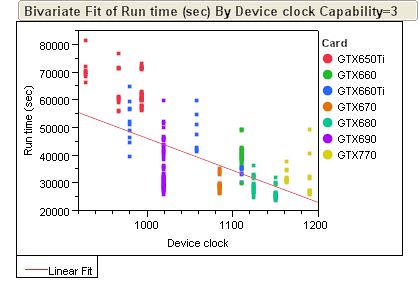 For looking at interactions, here is just the 3.0 capability cards. This part of the data set I had the most items per different groups so it shows the interactions the best. 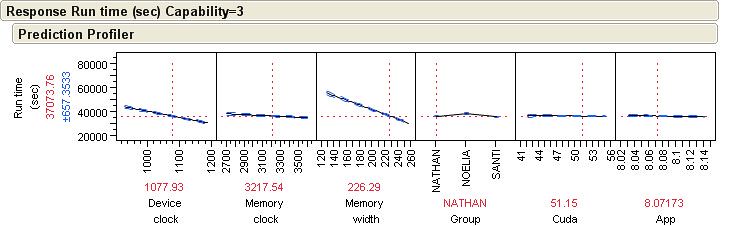 Here you can see the strong influence of device clock. The memory width only showed a strong interaction in this group which I am assuming it is due to the 650Ti having a 128bit width and skewing the review. Memory clock has a little impact, the NOELIA's are the longest runs, CUDA version and the ACMEDLong App version had no significant impacts. Regards, Jeremy |
|
Retvari Zoltan Send message Joined: 20 Jan 09 Posts: 2380 Credit: 16,897,957,044 RAC: 0 Level Scientific publications |
What shocked me for the first look at your graphs that the GTX 770 is slower at higher clocks than the GTX 680 (while these two cards are basically the same), so some other factor (CPU, CPU clock, RAM clock, PCIe bandwidth) must be skewing the data they're based on. |
|
Send message Joined: 13 Apr 13 Posts: 61 Credit: 726,605,417 RAC: 0 Level Scientific publications |
I looked at just the 680 and 770 data separately. The 680 data came from both XP32bit and XP64bit. The 770 data was Win7 64 bit only. That was the only face value difference I could see. One other thing on the Device Clock reporting. So for my GTX460 that I have set to 820MHz # Device clock : 1640MHz GPU-Z shows Default at 1520 and actual as 1640. For my GTX680 that I have set to a +26MHz # Device clock : 1124MHz GPU-Z shows Default as 1124, but actual as 1150MHz. Strange....I had looked at this a few days ago and had thought even on the 680 it was reporting the actual. Guess not. On top of this, this GTX680 is staying at a Boost of ~1201MHz most of the time. So I do not know how the GTX770 is performing, but there is definitely some wiggle room in the device clock reporting accuracy. So my current data set is confounded between Device Clock and OS. |

©2026 Universitat Pompeu Fabra